Collection Activity
See when cards are being added and how collection growth changes across the selected time period. Ranges are 7D, 30D, 90D, 1Y, and All. Activity can show Cards Added or Collection Size.
 Scott's TCG Binder
Analytics turns collection records into a broader view of collecting activity. Follow additions, estimated value, set completion, missing-card opportunities, duplicates, and other trends without having to manually assemble reports from the collection. These views describe the collection. They are not investment performance.
Mac
shot desktop-analytics · seq 17 · assets/screenshots/original/desktop/0017.png
iPhone
shot iphone-analytics · seq 111 · assets/screenshots/original/iphone/analytics.png
Additional platform screenshots will be added as this guide is expanded.
See when cards are being added and how collection growth changes across the selected time period. Ranges are 7D, 30D, 90D, 1Y, and All. Activity can show Cards Added or Collection Size.
Follow available estimated market-value information across the collection and compare changes over time. This is estimated value from available pricing, not a profit or return.
See how much of each set is represented in the collection and which sets are closest to completion. Sort by Completion, Missing, Owned, Name, Wishlist Overlap, or Most Duplicate Copies.
Compare collection coverage across sets in a visual format designed to make gaps easier to identify. The map can show Owned, Tracked, or All Sets.
Find sets that are closest to completion so collecting goals can be prioritized.
See where available pricing information has changed most within the selected period (7D, 30D, or 90D). A list stays empty until more than one pricing snapshot exists.
Global filters are Series, Sets, Rarity, Foil Type, Condition, Favorites, Date Added, and Pricing Availability. Section chips are Overview, Collection, Sets, Value, Activity, and Goals. Edit Dashboard can hide Collection, Sets, Value, and Goals. On a Mac, range and sort controls are a segmented row when the labels fit and a menu when they do not. On iPhone and iPad those same controls are always menus, including Collection Activity (Cards Added or Collection Size), Collection Value, Set Completion, and Top Gainers / Top Decliners. Metric Count and Metric Value remain chips on Collection by Rarity. Series and Sets remain chips on Value Distribution.
Mac
shot desktop-analytics · seq 17 · assets/screenshots/original/desktop/0017.png
iPhone
shot iphone-analytics · seq 111 · assets/screenshots/original/iphone/analytics.png

A consolidated view of collection activity, estimated value, and completion.
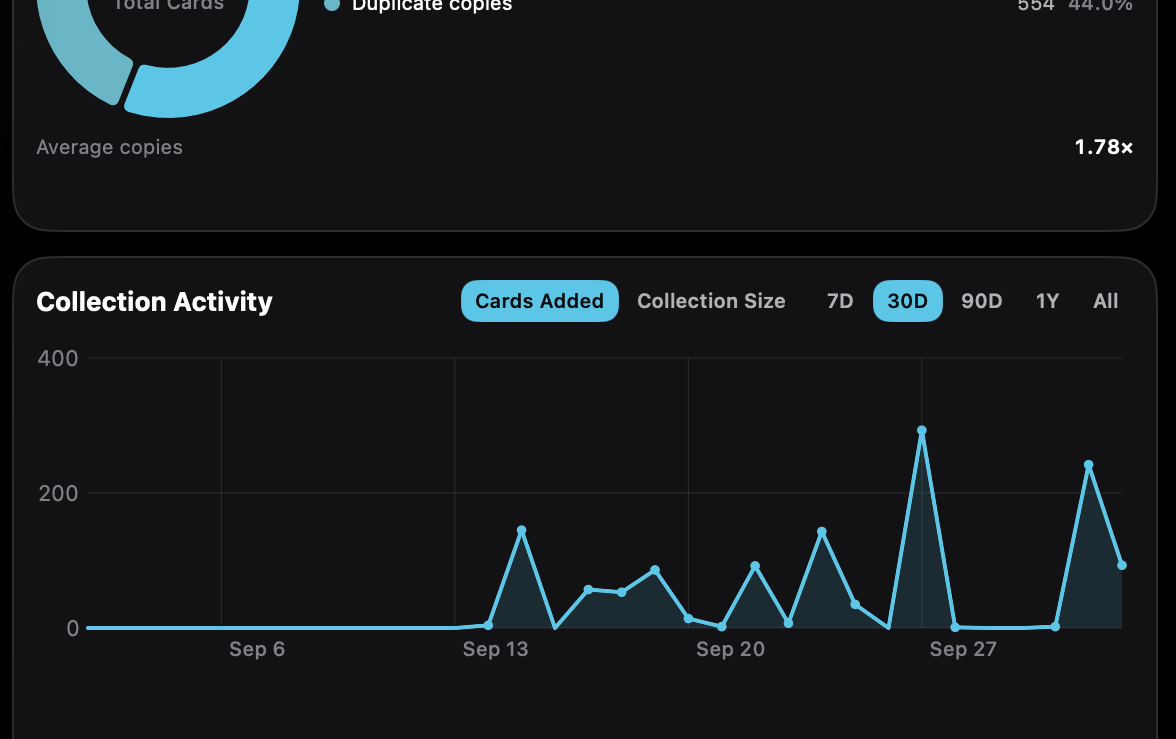
Collection Activity shows additions across the selected time range.
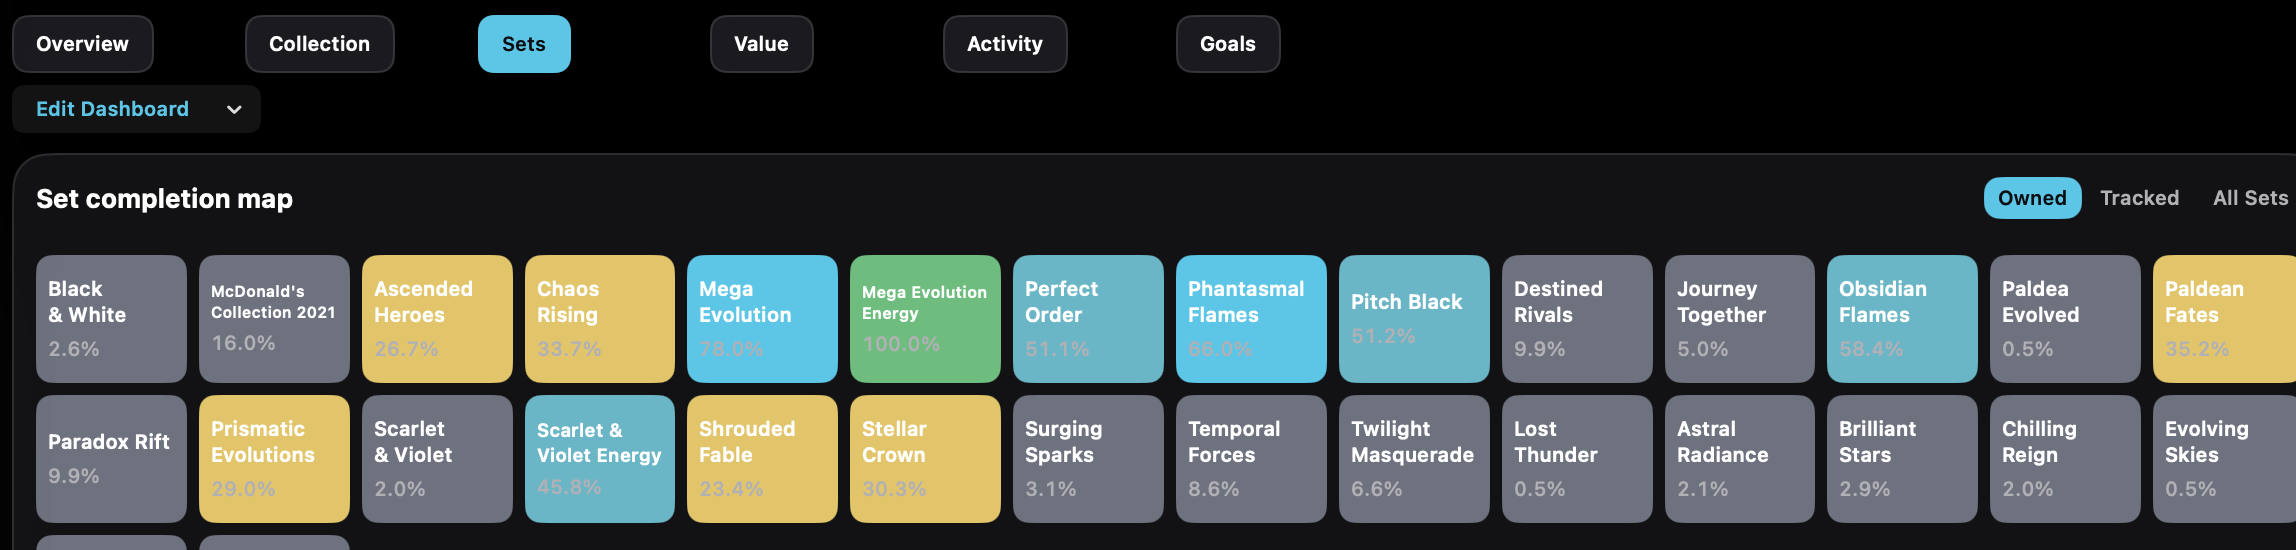
The completion map makes well-represented and lightly represented sets easier to see.
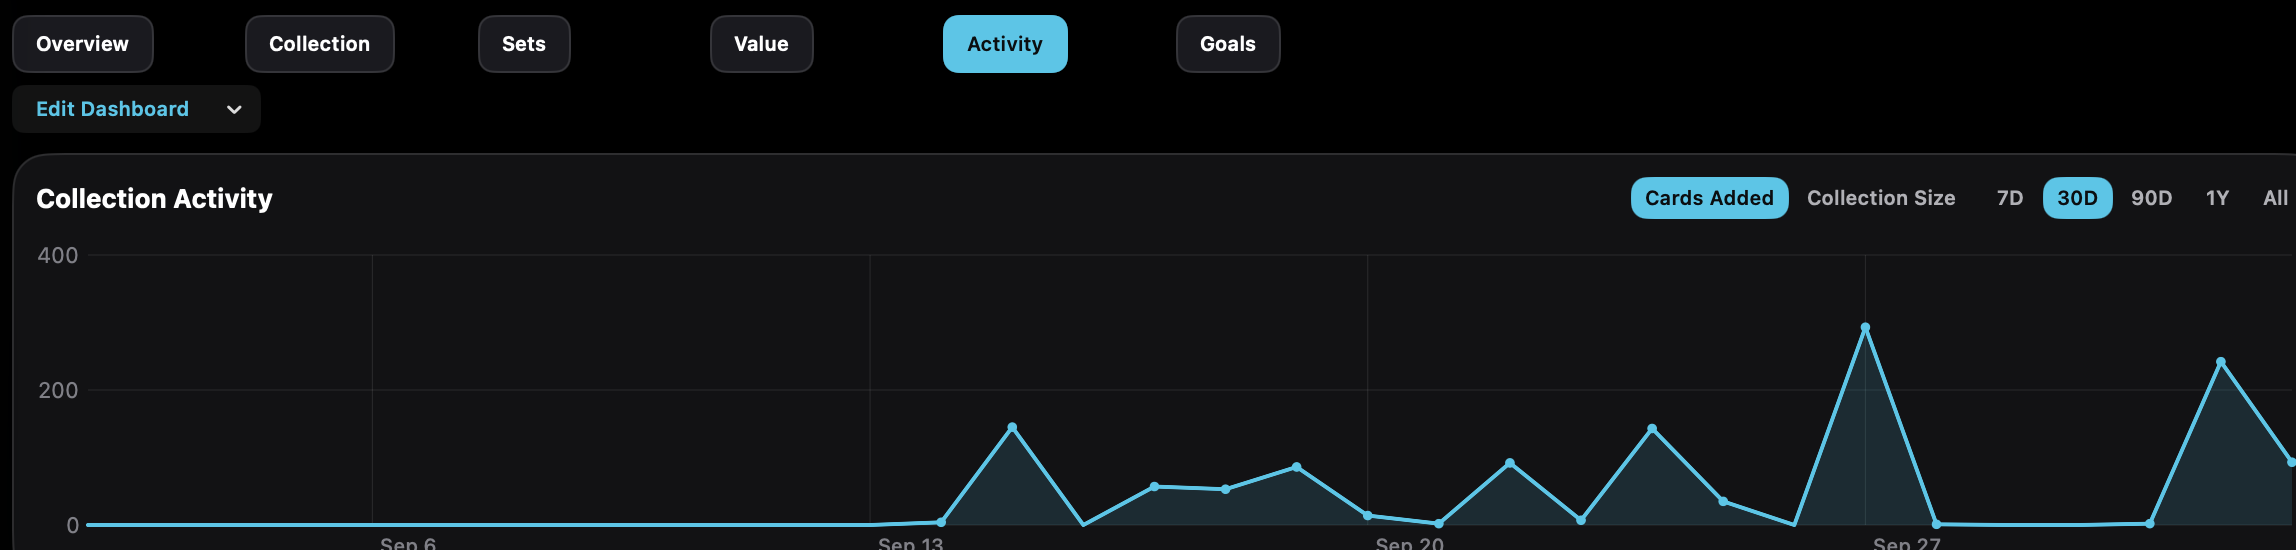
See when cards were added and how growth changes across the selected period.
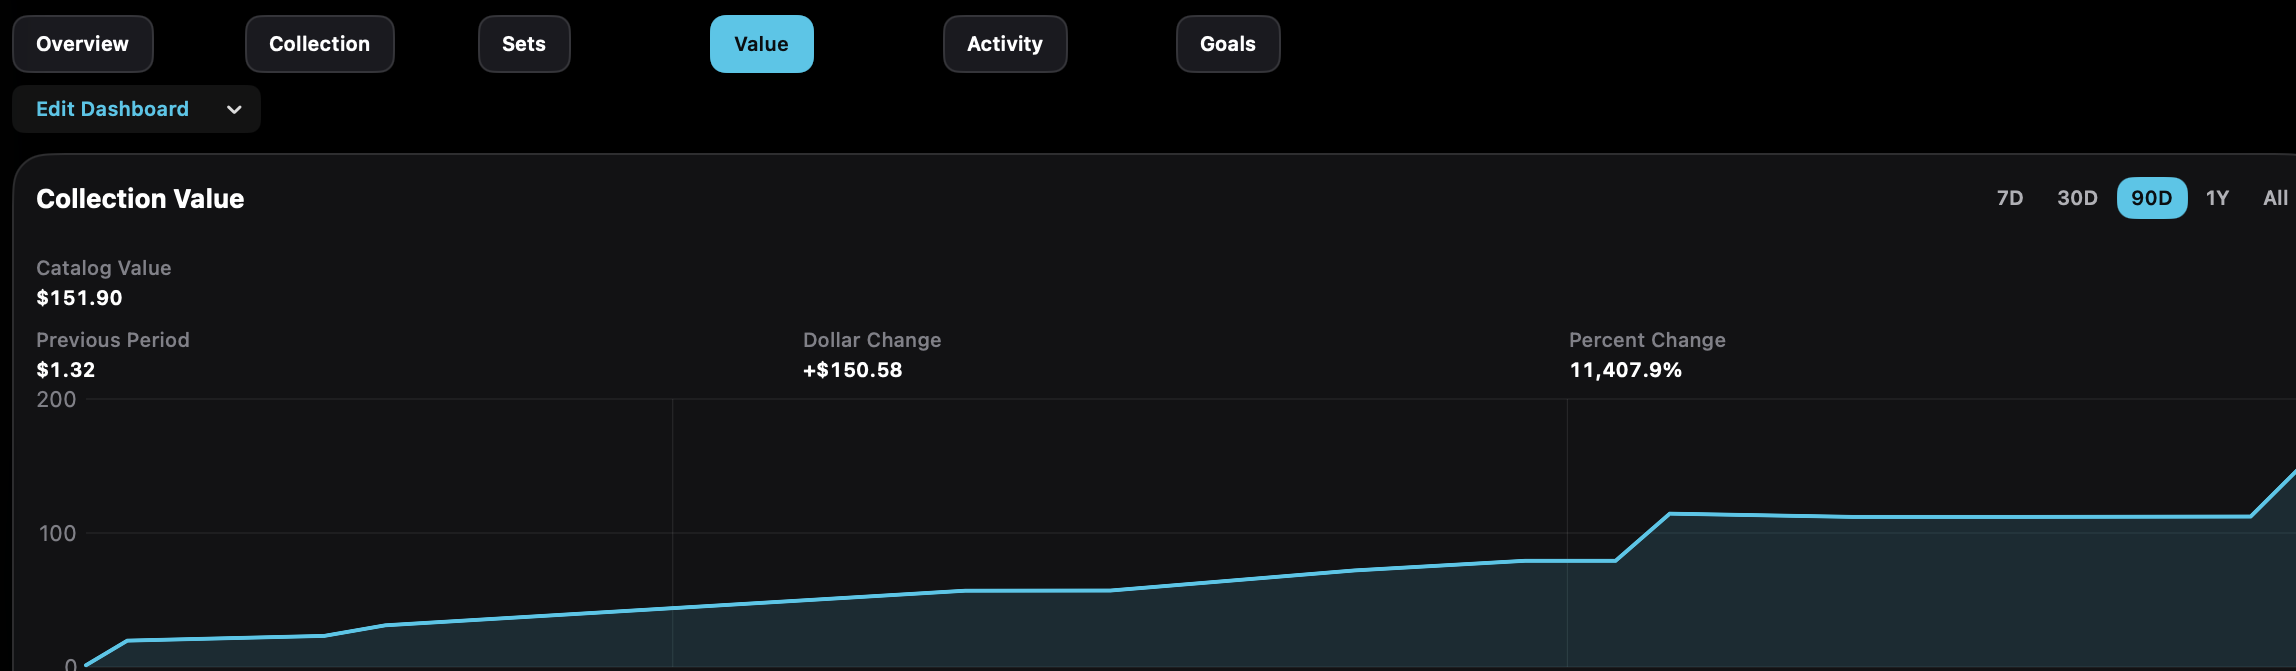
Follow available estimated market value and compare it over time.
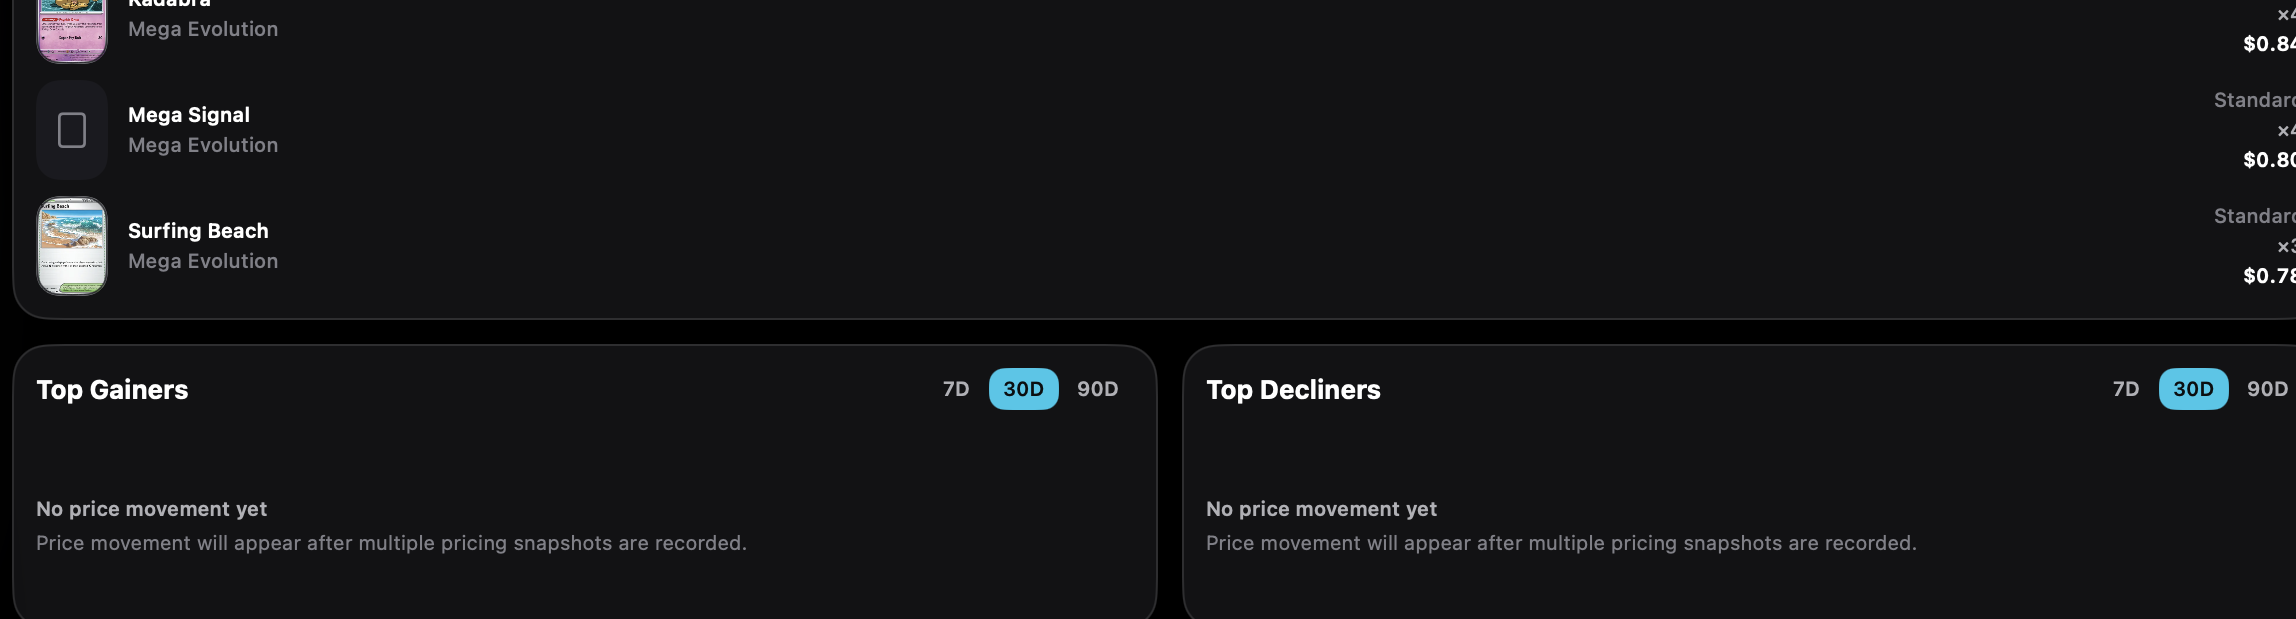
Review cards with the largest available pricing changes for the selected range.
Mac, iPhone, and iPad share the same collection model. Each platform presents those records in a layout that fits its screen.
Section chips wrap. Series, set, rarity, foil, condition, date, and pricing are menus.
Operational steps, controls, and the annotated screen.